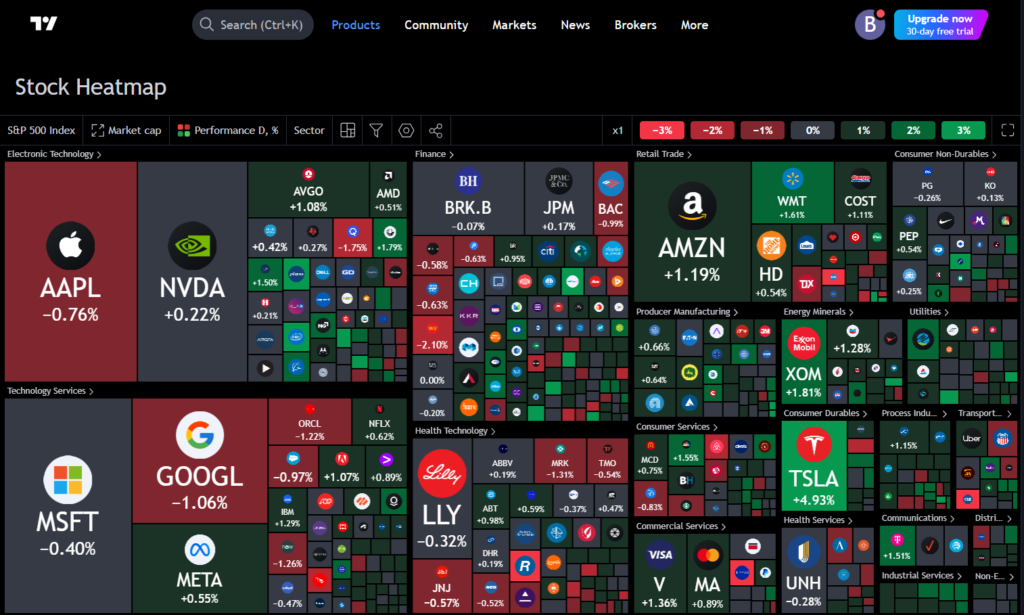
In the world of stock trading and investment, the ability to identify market leaders and laggards can significantly influence investment strategies.
One powerful tool that assists investors in this endeavor is the stock heatmap. But how exactly does a stock heatmap help in identifying these market dynamics? Let’s delve into the specifics.
Understanding Stock Heatmaps

A stock heatmap is a visual representation of market data that uses color coding to indicate the performance of various stocks. This innovative tool allows investors to quickly gauge the performance of multiple stocks within a specific timeframe.
The vibrant colors in a heatmap, typically ranging from bright green to deep red, represent different levels of performance. Bright colors indicate strong performance (market leaders), while dull colors denote weaker performance (lagging stocks).
Key Features of Stock Heatmaps
Here are some of the Key Features of Stock Heatmaps:
- Color Coding: The primary feature of a stock heatmap is its color gradient. Bright green signifies significant gains, while muted reds indicate losses. This color distinction allows investors to identify market leaders and laggards at a glance. For instance, if the technology sector appears predominantly green, it suggests that tech stocks are currently outperforming other sectors.
- Visual Comparison: Stock heatmaps arrange all stocks in a single grid, making it easy to compare relative performance. This visual approach enables investors to identify trends and make informed decisions. By quickly comparing sector performances, an investor can spot which industries are thriving and which are struggling.
- Pattern Identification: Heatmaps help reveal patterns within the market. For example, if several stocks in the energy sector are lagging while those in technology are leading, this information can inform investment choices. Recognizing these patterns allows investors to adjust their portfolios proactively.
- Customizable Parameters: Most heatmaps come with filtering options, enabling users to analyze data based on specific criteria like price changes, trading volume, or market capitalization. This customization enhances the analysis, allowing investors to focus on metrics that matter most to their strategies.
- Real-Time Analysis: A heatmap’s real-time data presentation provides investors with immediate insights into market dynamics. This feature is particularly beneficial during high volatility, where swift decisions can lead to significant profit or loss.
Also Read: Best Ways to Use TradingView Stock Heatmap For Portfolio Management
Using Stock Heatmaps for Trading
When utilizing stock heatmaps, investors can enhance their TradingView analysis significantly. For example, let’s imagine a heatmap where the technology sector is displayed in vibrant greens, indicating strong market performance.
In contrast, the energy sector is rendered in dull reds, suggesting that these stocks are lagging. This immediate visual feedback allows investors to shift their focus to sectors showing potential growth, effectively identifying market leaders.
Example of Market Leaders and Laggards
To illustrate, consider a stock heatmap indicating a strong performance in the healthcare sector while the retail sector shows signs of decline.
Investors can recognize that healthcare stocks are currently leading the market, possibly due to favorable regulatory changes or innovations, while retail stocks are lagging, perhaps due to supply chain issues or reduced consumer spending.
This insight allows investors to make strategic decisions, such as reallocating funds to capitalize on the healthcare sector’s upward trend while avoiding underperforming retail stocks.
Also Read: How Can TradingView Stock Heatmap Help You Visualize Market Trends?
The Importance of Identifying Market Leaders
Identifying market leaders is crucial for several reasons:
- Investment Strategies: By focusing on stocks that are currently performing well, investors can align their strategies with market trends. This alignment can lead to higher returns, especially in bullish market conditions.
- Risk Management: Understanding which sectors are lagging helps investors manage their risk. By avoiding stocks in declining sectors, they can safeguard their portfolios against significant losses.
- Trend Analysis: Recognizing trends early through heatmaps enables investors to enter positions before a stock reaches its peak performance, maximizing potential gains.
- Sector Rotation: Stock heatmaps assist investors in practicing sector rotation strategies, where they shift investments between sectors based on performance trends. This proactive approach can enhance portfolio performance and minimize exposure to underperforming areas.
Challenges and Considerations
While stock heatmaps are invaluable tools, they do come with challenges. For one, heatmaps only provide selective information and may not capture the complete market picture.
For instance, a heatmap may show a stock with declining prices but lack context regarding why that decline is occurring. Understanding the underlying factors—like earnings reports or broader economic conditions—is vital for making informed investment decisions.
Moreover, investors should remain cautious of over-reliance on heatmaps for trading decisions. It’s essential to combine heatmap analysis with other research methods, including fundamental analysis and market news.
Doing so ensures a comprehensive understanding of market conditions.
Conclusion
In conclusion, a stock heatmap is a powerful tool for identifying market leaders and lagging stocks. Its visual representation simplifies the analysis of stock performance, enabling investors to make quick, informed decisions.
By utilizing the color-coded data effectively, investors can gain insights into market trends and adapt their strategies accordingly. However, it’s crucial to complement heatmap analysis with additional research to navigate the complexities of the stock market effectively.
Investors who harness the power of stock heatmaps can position themselves advantageously in a competitive marketplace, identifying opportunities that align with their investment goals and risk tolerance.
In the ever-evolving world of trading, stock heatmaps stand out as a vital resource for anyone looking to thrive in the financial landscape.


