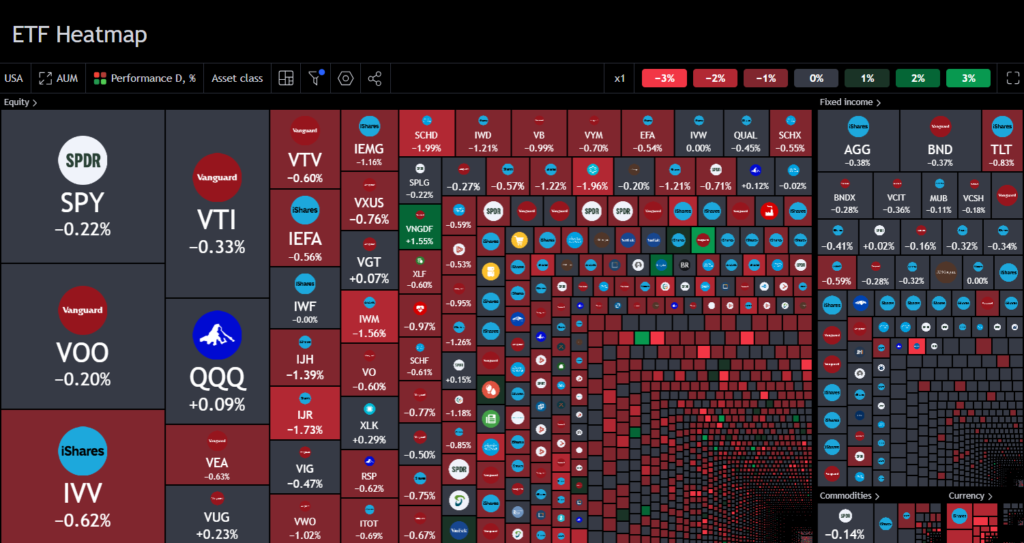
Exchange-traded funds (ETFs) have become a popular investment tool, offering diversification, low expense ratios, and the flexibility to trade like individual securities. When it comes to portfolio diversification, using an ETF heatmap can provide invaluable insights, helping investors make data-driven decisions.
This visual tool allows investors to quickly assess market trends, liquidity, and sector performance, making it an essential tool for portfolio management.
In this article, we’ll explore the best ways to use an ETF heatmap for portfolio diversification and how tools like TradingView can streamline this process.
Understanding ETF Heatmaps and Their Benefits
An ETF heatmap is a visual representation of market data, typically displayed using a grid format where different colors represent various market conditions. It shows the performance of ETFs in real-time, helping you monitor trends across multiple asset classes such as stocks, bonds, commodities, and sectors. The color-coding makes it easy to identify which ETFs are performing well and which are underperforming.
For instance, a green color typically indicates a rise in trading volume or price, while red shows a decline. Additionally, deeper shades of green or red signify more substantial changes in the price or volume, making it easy to gauge volatility at a glance.
Advantages of Using ETF Heatmaps:
- Real-Time Market Analysis: Heatmaps offer live updates, giving investors an edge in spotting emerging trends.
- Visual Clarity: Instead of analyzing tables of numbers, you get a clear visual snapshot of market performance.
- Efficient Decision-Making: Since heatmaps organize data efficiently, investors can make quick, informed decisions, enhancing their ability to respond to market changes swiftly.
Read More: How Can ETF Heatmap Help You Visualize ETF Market Trends?
Diversifying Your Portfolio Using ETF Heatmaps
One of the primary benefits of an ETF heatmap is its ability to enhance portfolio diversification. Diversification is a key strategy to reduce risk by spreading investments across different assets, industries, or geographies.
Here’s how ETF heatmaps can help:
a. Sector-Based Diversification
Using an ETF heatmap, you can identify how various sectors are performing. For instance, in a TradingView ETF heatmap, sectors like technology, healthcare, or real estate are displayed side by side. If the tech sector shows a consistent upward trend (green), you may decide to allocate more funds into tech ETFs. Conversely, if real estate is showing a downtrend (red), it may indicate a sector to avoid or divest from.
b. Geographical Diversification
ETF heatmaps also allow investors to diversify across geographical regions. Global heatmaps can display ETF performance across different countries or continents. For instance, you might see that North American ETFs are performing well, while European ETFs are lagging. This information can be used to balance your portfolio globally, reducing risk from being overly concentrated in one region.
c. Asset Class Diversification
Heatmaps aren’t limited to just equity ETFs; they can also include bonds, commodities, and other asset classes. By using an ETF heatmap, you can quickly identify opportunities to diversify across these classes. For example, if stock market volatility is rising, a heatmap might show that bond ETFs are performing well, signaling a safer investment option.
Read More: Visualize Bullish vs Bearish Trends with Stock Heatmap
Active Management Using ETF Heatmaps
While a buy-and-hold strategy works well for long-term investors, others prefer actively managing their portfolios to maximize returns. An ETF heatmap can help active investors by providing real-time data, allowing for quick portfolio adjustments.
a. Sector Rotation
Active traders can use heatmaps to execute a sector rotation strategy. Sector rotation involves moving investments from one sector to another based on performance. For example, if an ETF heatmap shows that energy ETFs are cooling down (red), but healthcare is heating up (green), you can rotate your portfolio by reallocating funds to healthcare ETFs. This tactic allows you to capitalize on emerging trends and minimize losses in declining sectors.
b. Identifying Opportunities for Rebalancing
Heatmaps can also help you rebalance your portfolio. Over time, as some ETFs outperform others, your portfolio can become skewed, with certain assets representing a higher percentage than intended. A heatmap can alert you to these discrepancies, prompting you to rebalance your investments and maintain your desired risk level.
Read More: Analyse Stock Market With TradingView Stock Heatmap
Using ETF Heatmaps for Day Trading
For more active traders or those involved in day trading, ETF heatmaps provide an excellent way to stay on top of short-term market movements. Since ETFs can be traded throughout the day, a heatmap allows you to identify patterns in real-time and execute trades at the opportune moment.
a. Intraday Trading
ETF heatmaps are particularly useful for intraday traders who need to buy and sell based on short-term movements. If you notice an ETF in a specific sector showing strong upward momentum (deep green), you may decide to buy in and hold for a short-term gain. Likewise, if an ETF begins to decline rapidly (dark red), the heatmap provides an instant signal to consider selling.
b. Identifying Volatile Markets
Heatmaps can also reveal areas of high volatility. Bright and deeply colored sections of a heatmap indicate significant price fluctuations, which can be both an opportunity and a risk. For day traders who thrive on volatility, these sections may signal where the most substantial gains (or losses) could occur. Tools like TradingView offer customizable heatmaps, allowing traders to focus on specific sectors or timeframes.
Tools and Platforms for Accessing ETF Heatmaps
Several tools, including TradingView, offer sophisticated ETF heatmaps that investors can use for portfolio diversification and active trading. TradingView’s platform is especially popular due to its user-friendly interface and ability to customize heatmaps based on sectors, asset classes, and geographic regions.
Key Features of TradingView’s ETF Heatmaps:
- Custom Filters: Customize heatmaps to focus on specific sectors, industries, or geographic regions.
- Real-Time Data: Get live updates on ETF performance, ensuring you have the latest information at your fingertips.
- Integration with Other Tools: TradingView integrates with other trading tools, allowing you to streamline your investment strategy and execute trades directly from the platform.
Read More: Spot Trading Opportunities with Stock Heatmaps: Tips & Strategies
Conclusion
An ETF heatmap is an indispensable tool for investors seeking to optimize their portfolio diversification. By providing real-time, visual insights into market trends and sector performance, heatmaps enable investors to make faster, more informed decisions. Whether you are a long-term investor aiming to diversify across sectors and asset classes, or an active trader looking to capitalize on short-term market movements, ETF heatmaps offer a flexible, efficient way to enhance your investment strategy.
Incorporating an ETF heatmap from platforms like TradingView into your portfolio management process can help you stay ahead of market trends, identify new opportunities, and mitigate risks. If you haven’t yet integrated this powerful tool into your investing approach, now is the time to start.


