Exchange-Traded Funds (ETFs) have become a prominent investment tool, offering investors easy access to diversified portfolios of stocks, bonds, or other assets.
A key question for investors, however, is whether to choose passive or active ETFs. Both strategies have their benefits and risks, but monitoring their performance can be made easier through tools like ETF heatmaps.
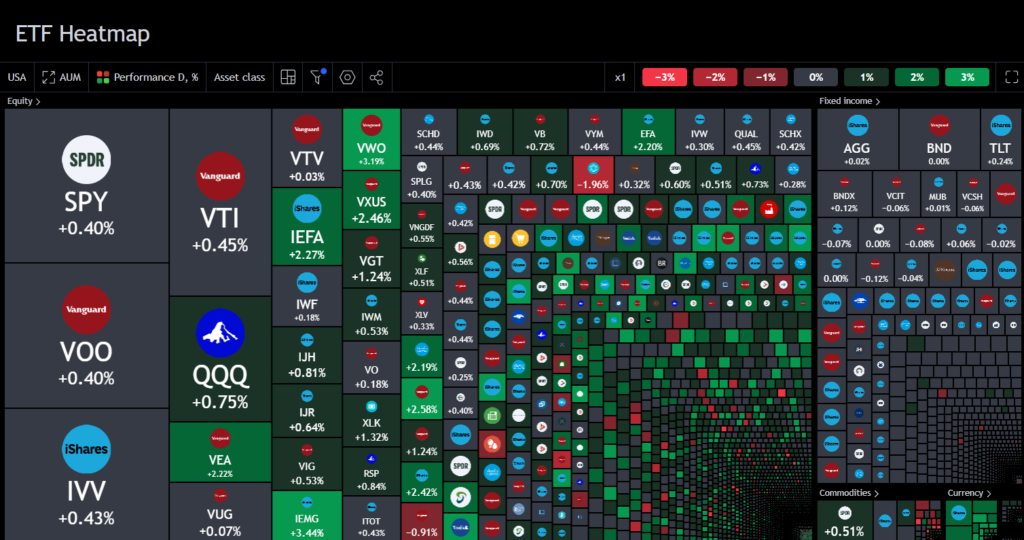
An ETF heatmap is a visual tool used on platforms like TradingView to track the performance of various ETFs. It presents a color-coded snapshot of how ETFs are performing, making it easier to compare and analyze different funds.
This article explores how an ETF heatmap helps you track passive and active ETFs and make more informed investment decisions.
Understanding Passive vs. Active ETFs
Before diving into how ETF heatmaps work, it’s important to understand the difference between passive and active ETFs.
| Feature | Passive ETFs | Active ETFs |
| Management Style | Passively managed, tracking a specific index | Actively managed, with a portfolio manager making decisions |
| Objective | To replicate the performance of an index | To outperform an index or benchmark |
| Expense Ratio | Generally lower | Typically higher due to active management fees |
| Trading Frequency | Trades less frequently | Can trade more frequently, adjusting positions |
| Transparency | Holdings are usually disclosed regularly | Holdings may be less frequently disclosed |
| Tax Efficiency | More tax-efficient due to lower turnover | Higher turnover may lead to more capital gains taxes |
| Performance Predictability | Predictable performance aligned with the index | Performance can vary widely based on manager decisions |
| Suitability | Ideal for long-term investors seeking steady returns | Suitable for investors looking for potential high returns |
| Investment Strategy | Follows a predetermined strategy | Utilizes various strategies, including market timing |
| Market Risk | Exposed to market risk of the index | May manage risk differently depending on strategy |
Passive ETFs aim to replicate the performance of a specific index, like the S&P 500 or the NASDAQ, by holding the same stocks or bonds as the index they follow. Passive ETFs are designed for long-term investors who prefer to “buy and hold” rather than actively trade.
In contrast, active ETFs are managed by professionals who make decisions about buying or selling assets in the ETF to outperform the market. While passive ETFs rely on the market’s general performance, active ETFs seek to generate higher returns by selecting undervalued securities or taking advantage of market trends.
Read More: Compare ETFs Effectively With the ETF Heatmap Tool
What is an ETF Heatmap?

An ETF heatmap is a data visualization tool that offers a color-coded view of various ETFs. Available on platforms like TradingView, it allows investors to quickly assess which ETFs are performing well and which are underperforming. Each block in the heatmap represents an individual ETF, and the color of the block indicates its performance, typically in terms of percentage gains or losses over a specific period.
The green shades in a heatmap usually represent positive returns, while red indicates negative returns. Darker colors suggest more extreme changes in performance, allowing investors to quickly identify market trends.
Tracking Passive ETFs with an ETF Heatmap
Long-Term Trends
For passive investors, the primary goal is to follow a long-term investment strategy that tracks a specific index. Passive ETFs, by nature, are less volatile and involve fewer trades. With an ETF heatmap, you can easily monitor the long-term performance of these funds in relation to the broader market. Since passive ETFs aim to mimic the returns of an index, you can use the heatmap to see how closely these ETFs align with their benchmarks.
For example, if you’re tracking a passive ETF that follows the S&P 500, a glance at the heatmap will show you how it compares to other similar funds. If most ETFs in that sector show gains (green), and your chosen ETF lags (red), it may be worth investigating further to ensure it’s performing as expected.
Low-Cost Investment Tracking
Another benefit of using ETF heatmaps for tracking passive ETFs is the focus on cost efficiency. Since passive ETFs generally have lower management fees compared to active ETFs, you can use the heatmap to track a variety of low-cost funds without being overwhelmed by data. A heatmap helps you quickly visualize cost-effective ETFs that offer consistent returns over time.
Also Read: Spotting ETF Trading Opportunities with TradingView Heatmap
Monitoring Active ETFs with an ETF Heatmap
Spotting Market Opportunities
Active ETF investors seek to capitalize on short-term market movements, sector rotation, or undervalued stocks. The dynamic nature of active ETFs means their performance can fluctuate more significantly. This is where the ETF heatmap becomes crucial for tracking real-time performance.
If you’re an active ETF investor, using a heatmap allows you to identify funds that are benefiting from current market conditions. For instance, during a tech sector boom, a heatmap may show tech-focused active ETFs glowing green, signaling strong performance.
This helps you make more informed decisions on which active ETFs to hold or sell.
TradingView and Real-Time Updates
Platforms like TradingView provide real-time updates on ETF performance. Active ETF investors benefit from this immediate data, allowing them to make timely buy or sell decisions. TradingView’s ETF heatmaps offer the ability to customize timeframes, enabling users to analyze performance over the past day, week, or month.
This functionality is particularly helpful for active traders who need to respond quickly to market movements.
Also Read: Key ETF Sectors to Watch With TradingView Heatmap
Benefits of ETF Heatmaps for Comparing Passive and Active ETFs
Ease of Comparison
One of the greatest advantages of using ETF heatmaps is the ability to quickly compare the performance of multiple ETFs at a glance. Whether you are investing in passive or active ETFs, a heatmap offers a clear snapshot of which funds are outperforming or underperforming.
This comparison tool is essential when deciding between passive and active ETFs. Passive investors can look for ETFs that are steadily performing in line with their benchmark index, while active investors can search for those with the highest potential for short-term gains.
Portfolio Diversification
ETF heatmaps can also help in diversifying your portfolio. By displaying ETFs across different sectors, asset classes, and regions, the heatmap allows you to see where opportunities lie. For example, if you’re invested in passive ETFs tracking the U.S. market but notice that emerging market ETFs are performing well, you might consider adding exposure to these regions.
Managing Risk
Lastly, heatmaps are valuable for managing risk. Passive ETF investors might want to minimize volatility, while active ETF investors may be comfortable with higher risks in exchange for potential outperformance. With an ETF heatmap, you can track the risk-return profile of various ETFs by observing their performance over time.
If an active ETF shows consistent green on the heatmap but has occasional sharp drops, you might interpret it as a higher-risk, higher-reward investment. In contrast, consistently light-green performance for a passive ETF could indicate stable, low-risk returns over the long term.
Read More: Identifying Top ETFs with TradingView ETF Heatmap
Final Thoughts
ETF heatmaps, especially on platforms like TradingView, are invaluable tools for both passive and active ETF investors. They offer a visually intuitive way to track performance, compare ETFs, and optimize your investment strategy. Whether you’re a long-term, buy-and-hold investor focusing on passive ETFs or an active trader seeking to outperform the market, an ETF heatmap provides the real-time data you need to make informed decisions.
By using this tool, you can strike a balance between the low-cost stability of passive ETFs and the potentially higher rewards of actively managed ETFs, all while maintaining a clear overview of market trends. Ultimately, ETF heatmaps are not just about tracking performance but empowering investors to tailor their portfolios to meet their financial goals.


