Investors constantly seek ways to navigate the ever-changing financial markets, and one proven strategy is sector rotation. Sector rotation allows investors to stay ahead of economic cycles by shifting investments between sectors poised to outperform while exiting those expected to underperform.
A crucial tool in implementing this strategy is the ETF heatmap—a visual guide that tracks sector performance, helping investors monitor sector rotations and make data-driven decisions.
This article delves into how you can leverage ETF heatmaps for optimizing your portfolio during market sector shifts.
Understanding Sector Rotation
Sector rotation is a strategy where investors allocate their funds to sectors expected to benefit from current or future economic conditions. The financial market does not move uniformly; different sectors perform better or worse at various stages of the business cycle. By identifying which sectors are rising and which are falling, investors can adjust their portfolios to maximize returns.
The business cycle typically moves through four stages—early recovery, late recovery, early recession, and full recession—with each stage favoring certain industries. For example, during an economic downturn, defensive sectors like utilities and healthcare tend to perform better, while cyclicals, such as consumer discretionary and industrials, may thrive during an economic recovery.
Also Read: Key ETF Sectors to Watch With TradingView Heatmap
Why Sector Rotation Works
Sector rotation works because not all industries respond to economic changes in the same way. Certain sectors react positively to economic growth, while others may provide safety during downturns. Investors who can anticipate these shifts position themselves to capitalize on market trends ahead of time. However, timing these rotations correctly is essential for success, and this is where tools like ETF heatmaps become valuable.
The Role of ETF Heatmaps in Sector Rotation

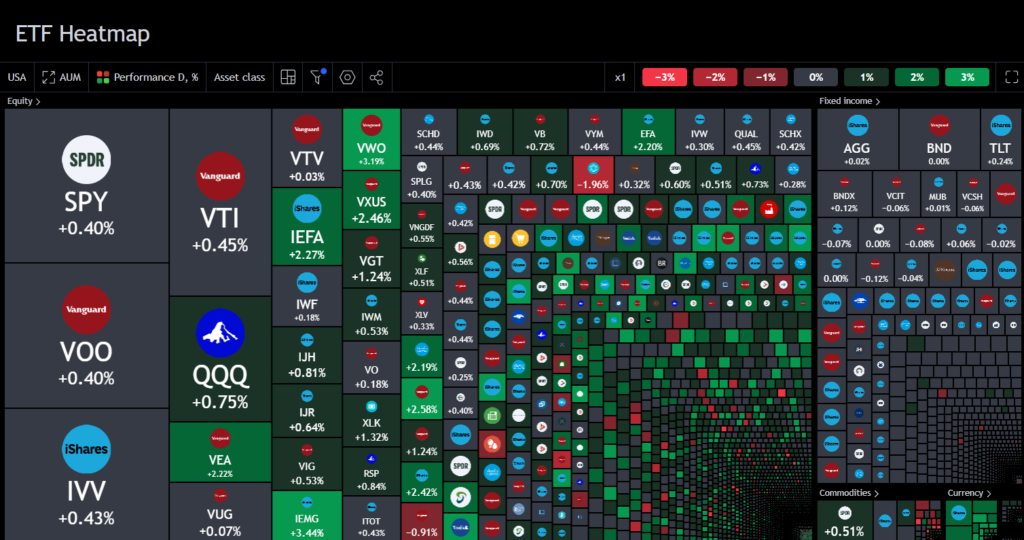
An ETF heatmap is a graphical representation of the performance of different sectors, where each sector is color-coded based on its relative performance. Heatmaps provide an instant overview of market activity, making it easier to identify outperforming and underperforming sectors at any given time.
With ETF heatmaps, investors can quickly see trends and patterns in sector behavior, allowing them to adjust their portfolios accordingly. For instance, if technology and healthcare sectors are heating up (indicated by bright green on the heatmap), an investor might consider increasing their exposure to these sectors. Conversely, if sectors like real estate or energy are cooling down (represented by red), it may signal a good time to reduce exposure.
Also Read: Track Passive vs. Active ETFs Using the ETF Heatmap
Sector Rotation Strategies Using ETF Heatmaps
There are several strategies investors can implement using ETF heatmaps to monitor sector rotations:
1. Economic-Cycle Strategy
The economic-cycle strategy is perhaps the most widely used approach in sector rotation. This strategy follows the theory that different sectors perform better at various stages of the business cycle. For instance, during early recovery, sectors like industrials and materials typically perform well, while energy and utilities may do better in later stages.
With an ETF heatmap, investors can monitor the strength of various sectors in real-time, providing a clear indication of where the economy might be headed. By analyzing sector performance, an investor can rotate into sectors likely to benefit from the current or upcoming economic stage, reducing exposure to sectors that are expected to decline.
2. Calendar-Based Strategy
Certain sectors perform better during specific times of the year. For example, retailers typically experience a boost during the holiday season, while energy sectors tend to perform well during the summer months due to increased demand for fuel.
By using an ETF heatmap, investors can track historical patterns and seasonal trends in sector performance. This approach allows them to capitalize on calendar-based opportunities by rotating into sectors that are seasonally strong and rotating out of those that are likely to underperform.
3. Geographic Strategy
Global economic conditions vary significantly across regions, and this can affect sector performance. For instance, while the U.S. economy might be experiencing a slowdown, emerging markets could be in a growth phase. With ETF heatmaps that include international sectors, investors can monitor sector performance across different regions and allocate their capital to the best-performing areas globally.
Also Read: Compare ETFs Effectively With the ETF Heatmap Tool
Monitoring Sector Rotations with ETF Heatmaps
Using ETF heatmaps effectively requires understanding how to read the heatmap data and applying it to your investment strategy. Here’s how you can leverage ETF heatmaps for monitoring market sector shifts:
1. Identify Sector Strength
ETF heatmaps are designed to provide a snapshot of sector performance over a given period. Investors should focus on sectors that consistently appear as top performers over various timeframes (daily, weekly, monthly). These sectors are likely benefiting from favorable economic conditions or trends, making them good candidates for increased investment.
2. Monitor Emerging Trends
While it’s essential to focus on current leaders, emerging trends can signal future sector performance. Keep an eye on sectors that are gradually moving up the ranks on the ETF heatmap. These sectors might be in the early stages of growth, and investing in them before they fully take off can lead to significant gains.
3. Diversify with Caution
While ETF heatmaps help pinpoint strong sectors, diversification is key to managing risk. Over-concentration in one sector can expose your portfolio to sector-specific risks. Use the heatmap to ensure a balanced allocation across several top-performing sectors, minimizing the risk of being overly reliant on one industry.
Risks of Sector Rotation Using ETF Heatmaps
Although sector rotation can enhance returns, it also carries risks. One major risk is timing—misjudging when to enter or exit a sector can lead to missed opportunities or losses. Additionally, sector rotation involves active management, which can lead to higher transaction costs.
ETF heatmaps provide a data-driven approach to minimize these risks, but no strategy is foolproof. It’s essential to remain flexible and monitor economic indicators closely to avoid being caught off-guard by sudden market shifts.
Also Read: Spotting ETF Trading Opportunities with TradingView Heatmap
Conclusion
ETF heatmaps are powerful tools for monitoring sector rotations and adjusting your portfolio accordingly.
By providing a clear, visual representation of sector performance, they make it easier to track market sector shifts and capitalize on opportunities across different industries. Whether you’re following an economic-cycle strategy, a calendar-based approach, or investing in global markets, ETF heatmaps offer valuable insights to enhance your sector rotation strategy.
However, always ensure you’re diversifying your portfolio and keeping transaction costs in check to maximize returns while mitigating risks.


