In today’s fast-paced financial markets, visual tools are invaluable for simplifying data analysis. TradingView’s stock heatmap offers a color-coded, easy-to-understand snapshot of stock performance, helping traders and investors quickly assess market trends.
Whether you are new to investing or an experienced trader, TradingView’s heatmap is a powerful tool that enables users to monitor stock market performance and discover new investment opportunities.
This guide explores how to effectively use TradingView’s stock heatmap, from basic setup to advanced customization, and demonstrates how this tool can optimize your investment decisions.
What is TradingView’s Stock Heatmap?

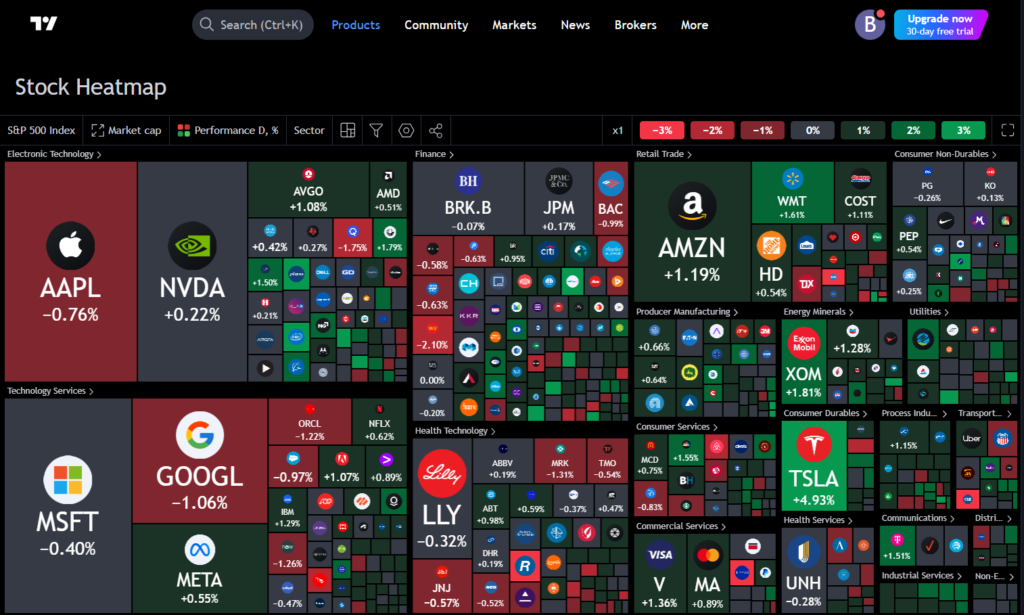
TradingView’s stock heatmap is a visual tool that presents stock performance data in an intuitive, color-coded format.
It organizes stocks into sectors and highlights each stock’s market performance based on predefined metrics such as price change, volume, or market capitalization. The heatmap’s primary advantage is its ability to display vast amounts of stock data in an easily digestible format, helping users spot trends at a glance.
For example, a green square on the heatmap indicates a stock that has gained in value, while a red square represents a stock that has declined.
The intensity of the color represents the magnitude of the change, with darker shades signifying greater changes in stock value. This feature is particularly useful when comparing multiple stocks across different sectors.
Also Read: Spot Trading Opportunities with Stock Heatmaps: Tips & Strategies
How to Access the Stock Heatmap on TradingView
To access TradingView stock heatmap, follow these simple steps:
- Step 1: Open TradingView and navigate to the “Products” section located at the top of the screen. Under “Screeners,” select “Stock Heatmap.”
- Step 2: Once the heatmap is open, choose the stock market index you wish to analyze. By default, the heatmap loads data for the S&P 500, but you can switch to other global indices such as the Nasdaq 100 or European Union stocks. To change the index, click on the name of the current index in the top left corner, and a search menu will appear for you to select a different index.
With just a few clicks, you can access the entire stock market’s performance, narrowing down opportunities based on sectors or specific stock groups.
Customizing the Heatmap for In-Depth Analysis
The strength of TradingView heatmap lies in its customizable features, which allow you to tailor data visualizations to your specific trading needs. Here’s how to configure the heatmap:
- Market Capitalization: The default heatmap configuration sizes companies according to their market capitalization. Larger companies appear as bigger squares on the map, helping you identify dominant players in each sector.
- Number of Employees: This configuration sizes companies based on the number of employees. For instance, large employers like Walmart will appear bigger compared to smaller companies like McDonald’s.
- Dividend Yield: Investors focused on income-generating stocks can configure the heatmap to reflect dividend yields. Companies with higher dividend payouts will appear larger, offering a quick snapshot of high-yield investment opportunities.
- Price-to-Earnings (P/E) Ratio: Use the P/E ratio filter to identify potentially undervalued stocks. Companies with lower P/E ratios will appear larger, highlighting stocks that may offer good growth potential based on their earnings relative to share price.
These customization options allow investors to focus on specific metrics most relevant to their trading strategies. Whether you’re targeting high dividend stocks or identifying companies with strong market capitalizations, TradingView heatmap enables precise, data-driven decisions.
Also Read: Key Sectors to Watch Using TradingView Stock Heatmap
Using the Heatmap to Analyze Stock Performance
The color-coded heatmap provides a visual representation of stock performance. Green and red colors dominate the heatmap, representing stocks that are gaining or losing value, respectively. To understand market sentiment at a glance, users can adjust the heatmap’s time frame to analyze short-term or long-term trends.
For instance:
- 1-Day Performance: Ideal for day traders or investors looking to capitalize on daily fluctuations.
- 1-Week/1-Month Performance: Useful for swing traders or those interested in medium-term investments.
- 6-Month/1-Year Performance: Best suited for long-term investors who want to analyze overall market trends over a longer period.
Additionally, users can track sector-specific performance by focusing on industry heatmaps (e.g., technology, healthcare, or finance sectors). This feature helps traders identify sectors outperforming the broader market.
How to Discover Investment Opportunities Using the Heatmap
One of the heatmap’s primary purposes is to help traders discover new investment opportunities. By analyzing sector performance, investors can find promising stocks that might not have been on their radar. Here’s how you can leverage TradingView’s heatmap for new investments:
- Sector Analysis: Start by analyzing sectors that show strong performance on the heatmap. For example, if technology stocks show significant green squares, this indicates that the sector is experiencing a bullish trend.
- Identify Market Leaders: Focus on the largest squares in green, which represent the biggest gainers. These are typically companies leading their sectors in growth and market cap.
- Spot Potential Rebound Stocks: Use the red squares to find companies that have recently underperformed. Some of these may be solid investment opportunities if they are poised for recovery, especially if their fundamentals remain strong despite short-term setbacks.
TradingView’s heatmap offers a highly visual way to scan the market for new opportunities quickly. By adjusting the map’s settings and filters, investors can uncover under-the-radar stocks with significant growth potential.
Also Read: How Does Stock Heatmap Help Identify Market Leaders and Laggards?
Conclusion
TradingView’s stock heatmap is an indispensable tool for both novice and seasoned investors. It simplifies complex stock data into a visually digestible format, enabling users to make informed decisions quickly.
By customizing the heatmap, investors can focus on metrics that align with their trading strategies, whether they prioritize market capitalization, dividend yield, or P/E ratios. With the ability to analyze global markets, TradingView’s heatmap helps investors spot trends and uncover new investment opportunities with ease.
Incorporating this powerful tool into your stock market analysis strategy will help enhance your market insights and improve your overall investment performance.
Also Read: Best Ways to Use TradingView Stock Heatmap For Portfolio Management


