With the fast-paced world of financial markets, staying informed is critical. Whether you’re trading stocks, ETFs, or cryptocurrencies, having real-time access to market news can help you make more informed decisions.
TradingView, one of the most widely-used financial platforms, offers tools that let you track breaking news and market trends alongside stock charts and technical indicators.
In this guide, we’ll dive into how to get stock-related news on TradingView, including the use of key features like the stock market graph, ticker tape, and more. We’ll also explore some of the best indicators on TradingView for spotting market trends and how to optimize your newsfeed for different asset classes.
Getting Started with TradingView’s News Feature
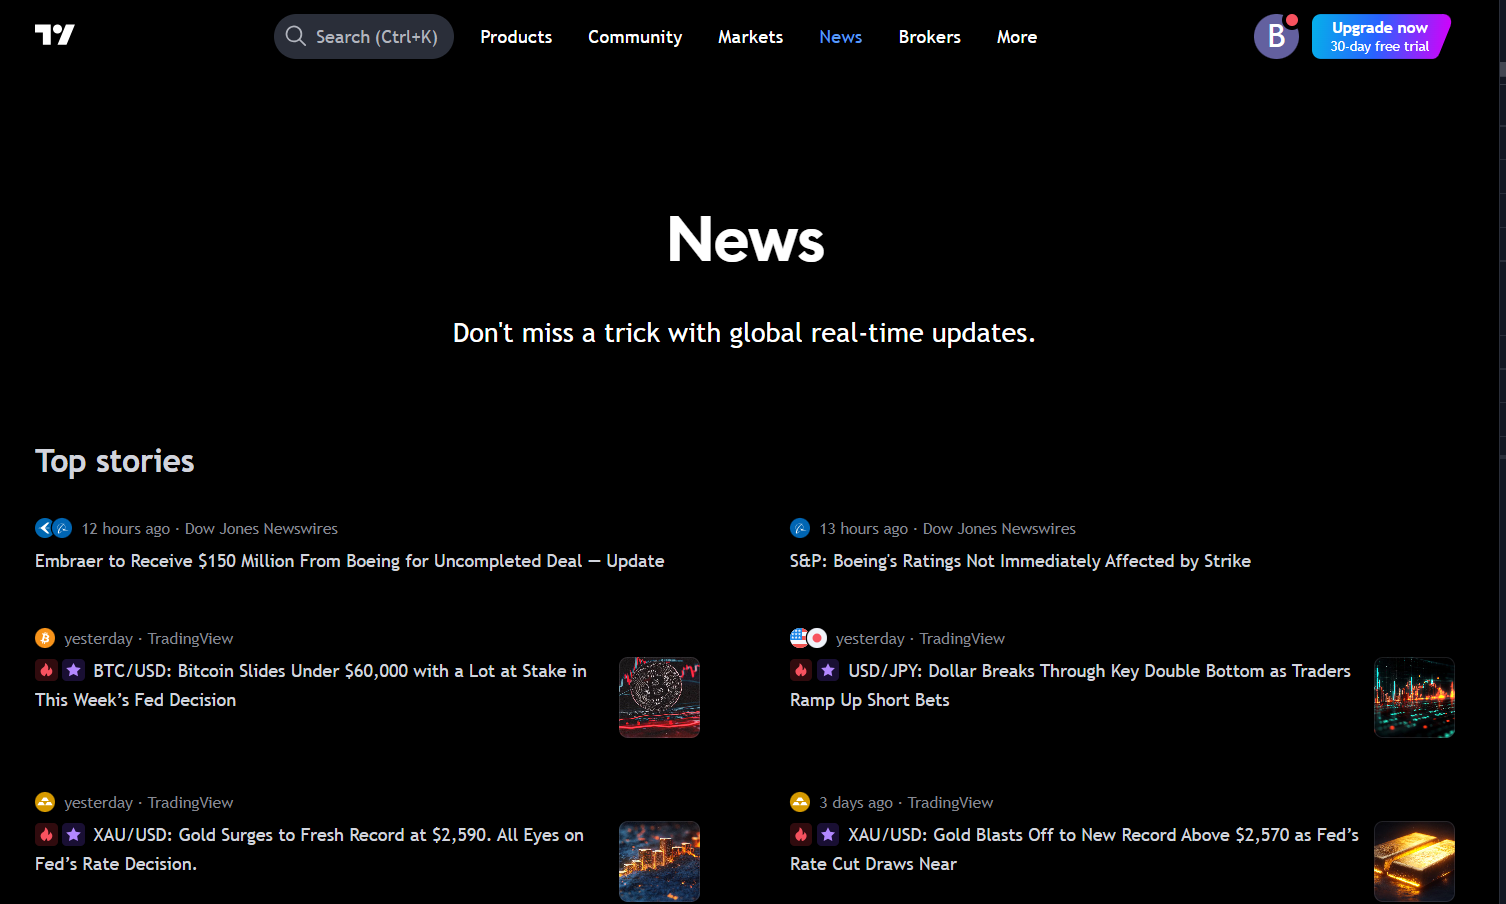
TradingView News allows you to track real-time financial news right on your charts. Whether you’re interested in equities, cryptocurrencies like BTC TradingView, or other assets, the platform integrates news seamlessly with market data.
Follow these steps to get started:
1. Accessing News on the TradingView Chart
- Open the TradingView chart for your preferred asset, such as a stock or ETF.
- On the right-hand side of the screen, you’ll see a toolbar with various icons.
- Look for the News icon (📰).
- Clicking on this icon will provide you with the latest real-time headlines related to the ticker symbol displayed on your chart.
2. Following Specific Stock Symbols
- Whether you’re tracking a major company stock or a cryptocurrency like BTC, TradingView lets you follow specific symbols for news updates.
- To do this, select a symbol from your watchlist, and relevant news headlines will appear.
- These headlines update in real-time, making it easy to connect market movements with underlying news.
You can also customize your TradingView India settings to follow specific companies, sectors, or even the global economy. This flexibility ensures that you get the news that matters most to your trading strategy.
3. Ticker Tape and Stock Market Graph Integration
TradingView’s platform integrates both the stock market graph and ticker tape features with breaking news. The ticker tape shows the latest prices, movements, and news across your selected markets. This can help you visually match market trends with headlines and react more quickly to changes.
For example, you can overlay the news feed on your chart to see how a significant event, like an earnings report, impacts a stock’s performance.
Customizing Your News Experience
With TradingView, customization is key. You can filter the type of news you want to see, set up alerts, and even access archived articles for deeper insights. This can be especially useful when you’re working with specific assets or sectors, such as ETFs or bonds.
Here’s how to make the most of these features:
Setting Up News Filters
TradingView’s ETF screener filters allow you to narrow down news based on asset types like high-dividend ETFs, large-cap stocks, or emerging markets. In addition, you can apply filters to your news feed to focus on specific regions, industries, or financial instruments.
For example, if you’re primarily focused on stock market trends in India, you can set up TradingView to show updates on TradingView India.
Using Earnings and Economic Events
Another feature integrated into TradingView’s charts is the earnings icon (📆). By enabling this, you can see upcoming earnings reports and economic events directly on the chart. The tradingview.com chart will show key data points, such as earnings per share (EPS) estimates, giving you a heads-up on upcoming market-moving events.
Additionally, you can check out the Earnings Calendar to keep track of companies’ reporting schedules, allowing you to prepare for potential stock price movements.
Best Indicators to Combine with News
To truly optimize your market analysis on TradingView, combine news with some of the best indicators on the platform. Here are some top indicators to consider:
1. Relative Strength Index (RSI) By tracking market momentum, RSI helps identify overbought or oversold conditions in a stock. Overlaying this indicator with news can help you confirm whether a stock’s reaction to news is justified or overhyped.
2. Moving Averages Simple moving averages (SMA) and exponential moving averages (EMA) are popular indicators for identifying price trends. Combining these with real-time news allows you to understand if a stock’s movement is in line with market trends or driven by sudden news events.
3. Volume Indicators Volume analysis helps assess the strength of price movements. For example, high trading volume in response to a news release might signal strong market conviction, while low volume could indicate that the market is unsure of the news’s impact.
Also Read: Some of the Best Indicators on Tradingview
Mobile Access: Stay Updated Anywhere
TradingView’s mobile app ensures you don’t miss out on important updates, even when you’re away from your desk. Available for both iOS and Android, the app provides access to real-time stock charts, news updates, and the full suite of indicators. You can filter news by asset class, top stories, or even global economic events.
Final Thoughts: Leverage News for Informed Trading
TradingView offers a rich ecosystem of tools for integrating real-time news with technical analysis. Whether you’re following stocks, ETFs, or cryptocurrencies, using features like the ticker tape, stock charts, and trade view on TradingView helps you stay informed. With customizable filters, earnings icons, and mobile access, TradingView is an essential tool for anyone looking to make informed trading decisions.
Always remember, while news is a critical component of market analysis, it’s essential to combine it with solid technical indicators and sound investment strategies.