Investment success often hinges on identifying the right sectors at the right time. TradingView’s stock heatmap is a valuable tool that allows investors to visualize market performance across multiple sectors, helping them pinpoint high-growth areas.
This article will guide you on how to effectively use TradingView’s stock heatmap to identify high-growth sectors for your investment portfolio.
What is a Stock Heatmap?

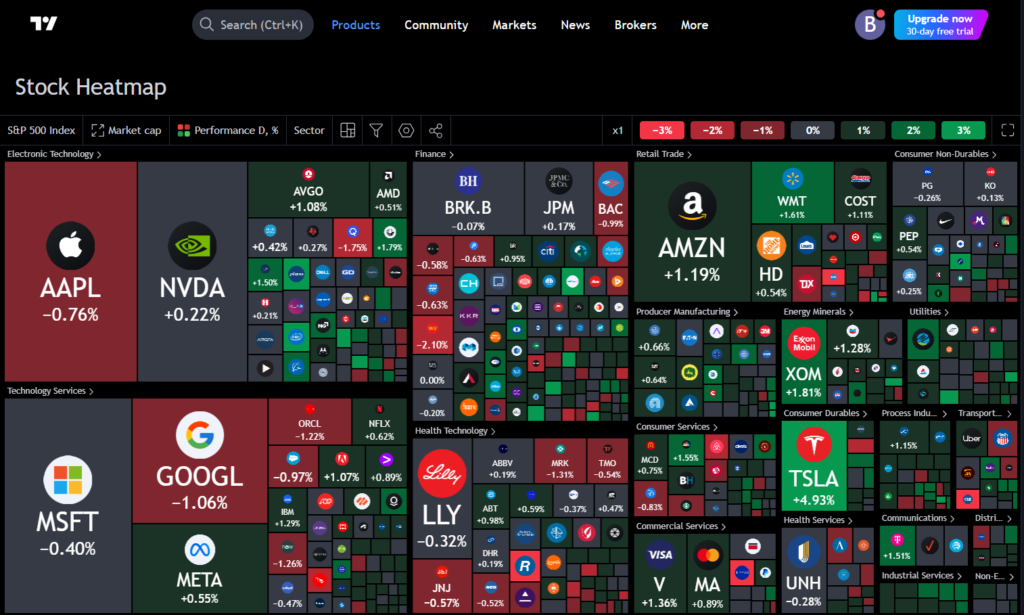
A stock heatmap provides a visual representation of stocks, grouping them by sector or index while color-coding performance metrics like price changes, trading volume, and volatility.
This allows traders to see, at a glance, how individual stocks or entire sectors are performing. TradingView’s stock heatmap offers comprehensive coverage, including US, European, and other global markets, allowing investors to compare different regions and sectors.
Also Read: Visualize Bullish vs Bearish Trends with Stock Heatmap
Step-by-Step Guide to Using TradingView’s Stock Heatmap
Here are the Step-by-Step Guide to Using TradingView’s Stock Heatma:
1. Opening the Stock Heatmap
To access the stock heatmap on TradingView, first navigate to the “Products” section located at the top of the platform.
From there, select “Screeners” followed by “Stock” under the Heatmap section. For users on the TradingView desktop app, the heatmap can also be accessed by clicking the “+” icon and selecting “Heatmap – Stocks.”
The stock heatmap loads with a default index, such as the S&P 500, but you can easily change this to focus on different indices, including the Nasdaq 100 or European markets.
2. Creating a Heatmap for Specific Stocks
Once the heatmap is open, you can customize it to focus on a specific set of stocks. Click on the index name in the top left corner and choose from a variety of global indices. For example, if you are interested in high-growth sectors within US markets, you might start with the S&P 500 heatmap.
With the ability to switch between indices, you can compare the performance of companies across different markets and sectors, enabling you to spot trends in high-growth sectors like technology, healthcare, or clean energy.
3. Customizing the Stock Heatmap
TradingView’s stock heatmap provides several customization options to tailor the visualization to your needs. This includes adjusting the “Size By” and “Color By” settings to display specific metrics that can help you identify high-growth stocks and sectors.
Size By Options
- Market Cap: This default setting sizes companies based on market capitalization. Larger companies like Apple or Amazon will appear bigger, but smaller high-growth stocks may be missed if not explored in detail.
- Number of Employees: Useful for investors who want to focus on large employers, as larger squares represent companies with more employees.
- Dividend Yield (%): This setting sizes stocks by the dividend yield, which is useful for investors seeking income-generating stocks. Companies with no dividend will be excluded.
- Price-to-Earnings (P/E) Ratio: A critical metric for identifying growth sectors. High P/E ratios can indicate high growth expectations, while low P/E ratios might reveal undervalued stocks.
- Volume (1h, 4h, D, W, M): This option sizes squares based on trading volume, which can signal stocks with high liquidity and interest.
Color By Options
Customizing the color scheme of the heatmap allows you to visualize stock performance by various time intervals:
- Performance (D, W, M, YTD, 1Y): One of the most commonly used settings, this option color-codes stocks based on performance changes over different periods (daily, weekly, monthly, or yearly). Green shades indicate positive performance, while red shades indicate declines.
- Volatility (D, %): Volatility measures the price fluctuations of a stock. By color-coding volatility, investors can quickly identify high-risk, high-reward stocks or sectors.
- Relative Volume: This measures current trading volume against historical averages. Stocks with unusually high activity are highlighted, potentially indicating new trends or emerging high-growth sectors.
4. Applying Filters to Refine Your Search
The stock heatmap also includes powerful filtering options, allowing you to narrow your focus on specific metrics to uncover high-growth sectors. Filters include:
- Market Cap: Filter out smaller companies to focus on large-cap stocks, which may dominate certain sectors like technology or healthcare.
- P/E Ratio: Target sectors with high P/E ratios to find growth companies with strong future earnings expectations.
- Dividend Yield: If you’re looking for dividend growth, filter stocks based on yield percentages, highlighting sectors like utilities or consumer staples.
By adjusting these filters, you can remove market “noise” and focus on high-growth sectors that match your investment strategy. For example, an investor could filter the S&P 500 to show only technology stocks with a low P/E ratio and high relative volume, highlighting undervalued companies with strong growth potential.
5. Using the Heatmap to Compare Sectors
A powerful feature of TradingView’s stock heatmap is its ability to group stocks by sector. This grouping allows you to zoom into specific industries like technology, healthcare, or finance and evaluate their performance in real time.
For instance, in a volatile market environment, you might want to focus on defensive sectors like healthcare or utilities, which typically offer more stability. Conversely, in a bullish market, high-growth sectors like technology or clean energy might provide the best opportunities for growth.
With the “Group By” option, you can toggle between sectors to compare their overall performance or focus on a specific industry. By zooming in on high-performing sectors, you can identify leading stocks and make informed investment decisions.
6. Identifying High-Growth Sectors
TradingView’s heatmap is an excellent tool for identifying high-growth sectors by visually comparing the performance of different stocks and industries. Sectors such as technology, renewable energy, and healthcare often exhibit strong growth, especially during economic expansion phases.
By customizing the heatmap with filters like market cap, P/E ratio, and relative volume, investors can pinpoint high-growth sectors and select individual stocks that show potential for future gains.
Also Read: Compare Major Indices Using Stock Heatmap on TradingView
Conclusion
TradingView’s stock heatmap is an indispensable tool for investors looking to identify high-growth sectors. By visualizing stock performance, customizing filters, and grouping by sector, the heatmap allows you to make informed, data-driven decisions.
Whether you are a seasoned trader or just starting out, TradingView’s stock heatmap provides the insights needed to spot opportunities in the ever-changing landscape of global equity markets.
By following the steps outlined in this guide, you can leverage the power of TradingView’s stock heatmap to identify high-growth sectors and make smarter investment choices.


