In the fast-paced world of stock trading, time is of the essence. Traders and investors need tools that allow them to analyze market conditions quickly and effectively.
A stock heatmap is one such tool that visually represents bullish market and bearish trends using a color-coded system. It provides a snapshot of market sentiment, offering a clear comparison between various stocks and major indices, such as those available on platforms like TradingView.
This article will explore how stock heatmaps work, how they represent bullish versus bearish trends, and why they are valuable for traders in both bullish and bearish markets.
What Is a Stock Heatmap?

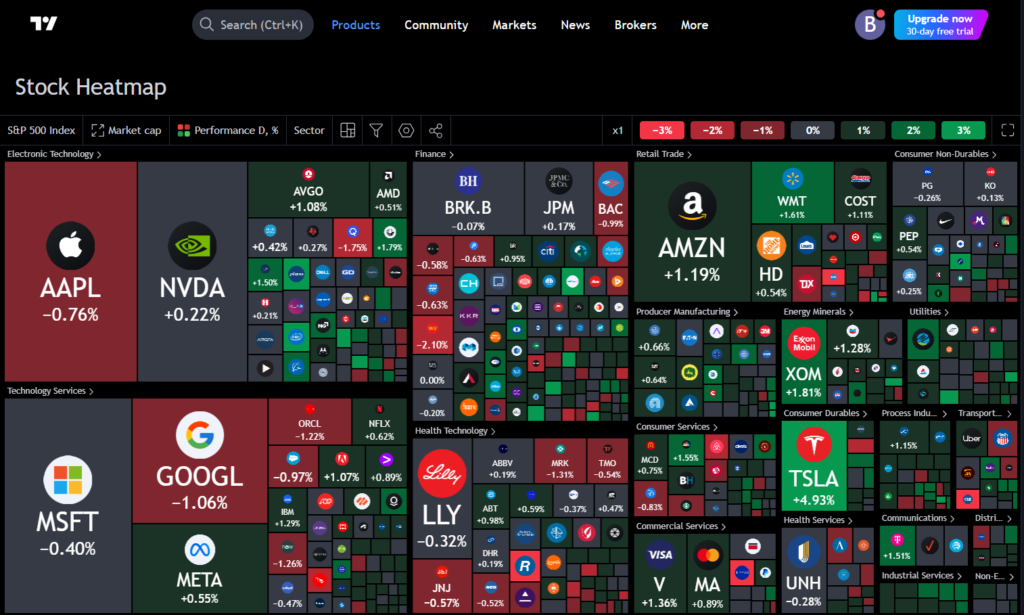
A stock heatmap is a graphical tool that displays stock performance using color gradients. It allows users to see how different stocks are performing in real-time or over a specific period, enabling a quick visual interpretation of market conditions.
Typically, a heatmap consists of squares or rectangles, each representing a stock or an index. These blocks are colored according to price changes:
- Green shades represent bullish markets (rising prices).
- Red shades represent bearish trends (falling prices).
- The intensity of the color indicates the magnitude of the change. Deeper shades signify more extreme price movements, while lighter shades indicate milder changes.
Additionally, the size of each cell on a heatmap can sometimes indicate trading volume, with larger cells representing higher volumes of trade, adding another layer of insight for users.
Also Read: Compare Major Indices Using Stock Heatmap on TradingView
Visualizing Bullish vs Bearish Market Trends
1. Color Coding to Reflect Market Sentiment
The primary function of a stock heatmap is to visualize market sentiment. By using color coding, stock heatmaps make it easy to distinguish between bullish and bearish trends.
In bullish market conditions, stocks experiencing upward momentum will be shown in shades of green, ranging from light green for modest gains to dark green for significant price increases. Conversely, in a bearish market, stocks experiencing downward trends will be displayed in shades of red, with darker reds indicating steeper losses.
2. Intensity of Color and Market Magnitude
Heatmaps offer a clear representation of market magnitude. The intensity of the color on a heatmap—whether green or red—reflects how strong the price change is for that particular stock or index.
For example, if a stock’s price has risen sharply in a bullish trend, its color block will appear as a deep green, signaling investors to the stock’s strong performance. In contrast, a deep red block will highlight stocks experiencing significant losses, indicative of a bearish trend.
Comparing Stocks and Indices
One of the key benefits of a stock heatmap is its ability to compare market sentiment across different stocks and indices in one visual representation. This makes it easier for investors to:
- Identify leading stocks in a bullish market by quickly spotting which stocks have dark green blocks.
- Spot stocks that are underperforming or lagging in a bearish market by focusing on those represented by red blocks.
- Analyze sector-wise performance to understand whether an entire industry is experiencing bullish or bearish trends, or if it is just isolated stocks.
For instance, a heatmap could show that tech stocks are predominantly green, indicating that the sector is performing well, while energy stocks are red, signaling bearish trends.
Also Read: Analyse Stock Market With TradingView Stock Heatmap
How to Interpret Stock Heatmaps for Strategic Trading
Stock heatmaps simplify trading by allowing users to interpret large sets of data in seconds. Here’s how traders can leverage this tool:
1. Identifying Bullish Stocks
To spot bullish opportunities, traders can look for stocks with bright green colors on the heatmap. These represent stocks that are experiencing price gains, suggesting strong buying pressure and market optimism. By identifying such stocks, traders can capitalize on upward momentum.
2. Identifying Bearish Stocks
On the flip side, bright red colors on the heatmap represent bearish stocks. These are stocks experiencing price declines, indicating selling pressure or pessimistic market sentiment. Recognizing these bearish trends allows traders to take defensive measures, such as selling positions or shorting stocks to benefit from the downtrend.
3. Sector and Market-Wide Trends
By comparing heatmap indices, traders can easily see which sectors are thriving and which are struggling. For example, if the financial sector is predominantly red, while technology stocks are green, investors can reallocate resources into the growing sector while avoiding underperforming industries.
Also Read: Spot Trading Opportunities with Stock Heatmaps: Tips & Strategies
Stock Heatmap Use Cases for Better Insights
Stock heatmaps are highly versatile tools used across various industries and platforms like TradingView. They simplify data visualization, making it easier for both novice and experienced traders to quickly understand market trends. Heatmaps have been used in multiple domains to offer insights, from stock market analysis to website analytics.
A stock heatmap can also be highly valuable for traders monitoring major indices. By using a heatmap, traders can visually track how indices like the S&P 500 or the NASDAQ are performing, comparing sectors or individual stocks to gain a comprehensive understanding of market sentiment.
Also Read: Key Sectors to Watch Using TradingView Stock Heatmap
Enhancing Trading Strategies with Stock Heatmaps
Incorporating stock heatmaps into your trading strategy can significantly enhance decision-making processes. Here are a few ways traders can use heatmaps to their advantage:
- Immediate Market Sentiment Analysis: Stock heatmaps provide a snapshot of the market, allowing traders to gauge the overall sentiment quickly.
- Risk Management: By identifying bearish trends early through red shades, traders can reduce their exposure to risky stocks.
- Sector Rotation: Investors can use heatmaps to rotate between sectors, investing in bullish areas and avoiding bearish ones.
- Comparative Analysis: Using heatmaps alongside other analysis tools, traders can compare major indices and make more informed decisions.
Conclusion
Stock heatmaps offer a powerful and visually intuitive way to understand bullish and bearish market trends.
By transforming complex numerical data into easy-to-read color patterns, these heatmaps allow traders to quickly assess the market, spot opportunities, and manage risk effectively.
Whether you’re analyzing individual stocks, entire sectors, or stock heatmap indices, this tool is invaluable for those looking to gain a competitive edge in the fast-moving stock market.


